
Transforming an annual report to showcase impact and reduce cost
Completed the project 53% under budget and ~1/5 the price of the previous year's report
Restructured the report to show organization-wide impact
Skills utilized
Project management
Vendor management
Creative direction
Graphic design
The Challenge
When the time came to start the 2020 annual report, I faced two challenges:
Showcasing the cross-team impact for the whole organization.
Traditionally, Sabin structured the annual report in a programmatic way, highlighting the different achievements for each program team. However, this doesn't tell the whole story. Our teams partner with each other and often work within similar themes, which is why we wanted to rethink the report’s structure this year.
Reducing the budget for the annual report.
While starting this project, I was also gearing up for a complete rebuild of the sabin.org website, which requires substantial funds. Therefore, I set out with a goal of drastically reducing expenses for the annual report while maintaining quality.

The Solution
After some research, I found a service that specializes in creating annual reports for organizations. This approach would not have all the flexibility as a custom built microsite, but it would save on time and money while maintaining a strong visual impact. I coordinated with the company to ensure the service would meet our needs and managed the vendor throughout the project.
We restructured the report by working with each program team to showcase how Sabin is making impact within distinct themes (i.e. vaccine acceptance), rather than each individual team’s projects. This gives readers and funders a holistic understanding of our accomplishments.
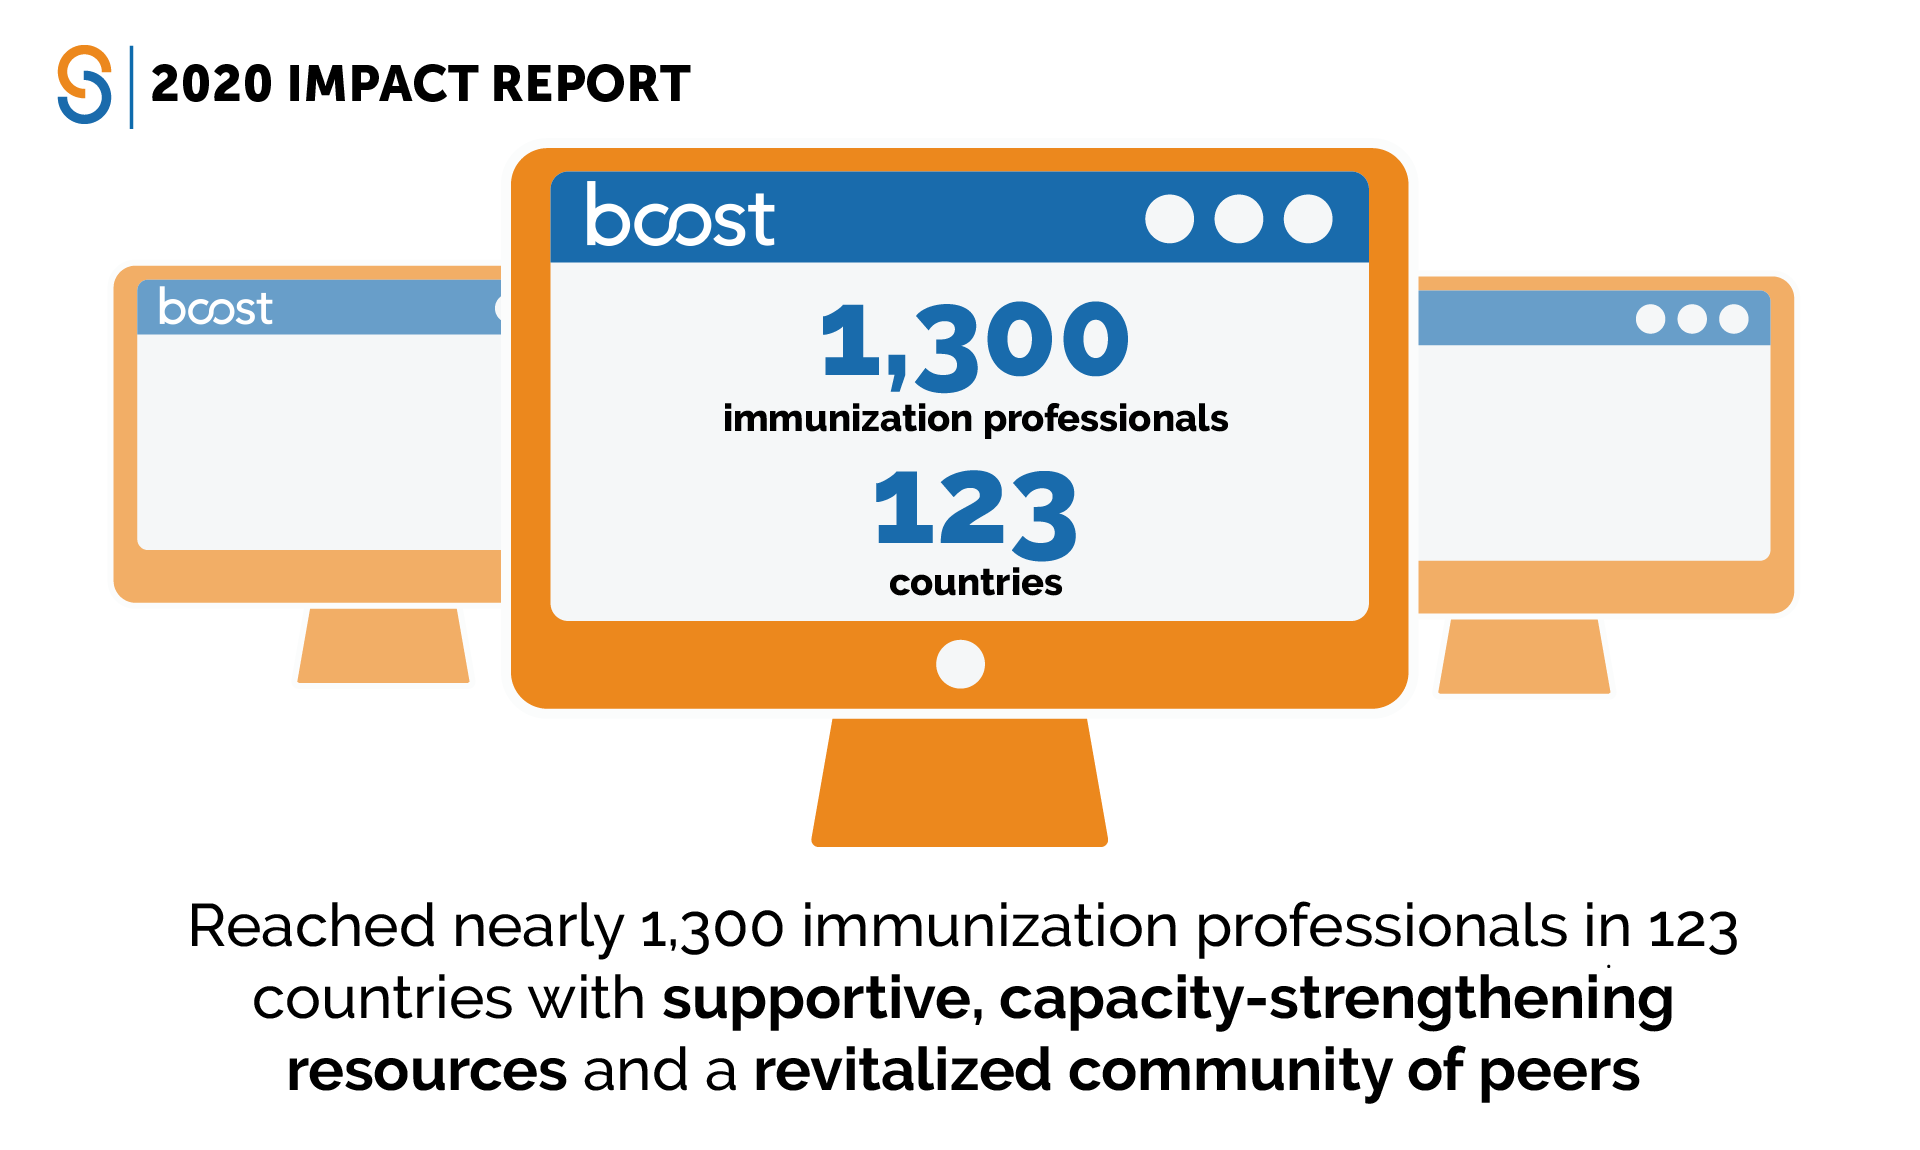
To drive home the visual impact, I collected key data points across the organization and designed a series of infographics for the “2020 in Review” section.
In the end, the project came in 53% under the projected budget and ~1/5 the price of the previous year's report. Also, we successfully showcased organization-wide impact.
Showcasing organization-wide impact through infographics


Completed the project 53% under budget and ~1/5 the price of the previous year's report.
Credits/team
Yearly.report - Vendor and content entry
Mary Beth Woodin - VP of Communications
Noah Duff - Project Manager for content
Cheryl Blowers - Writer
Dean Kline - Copyeditor
Jose Alfaro - Social Campaign